Sample Answer
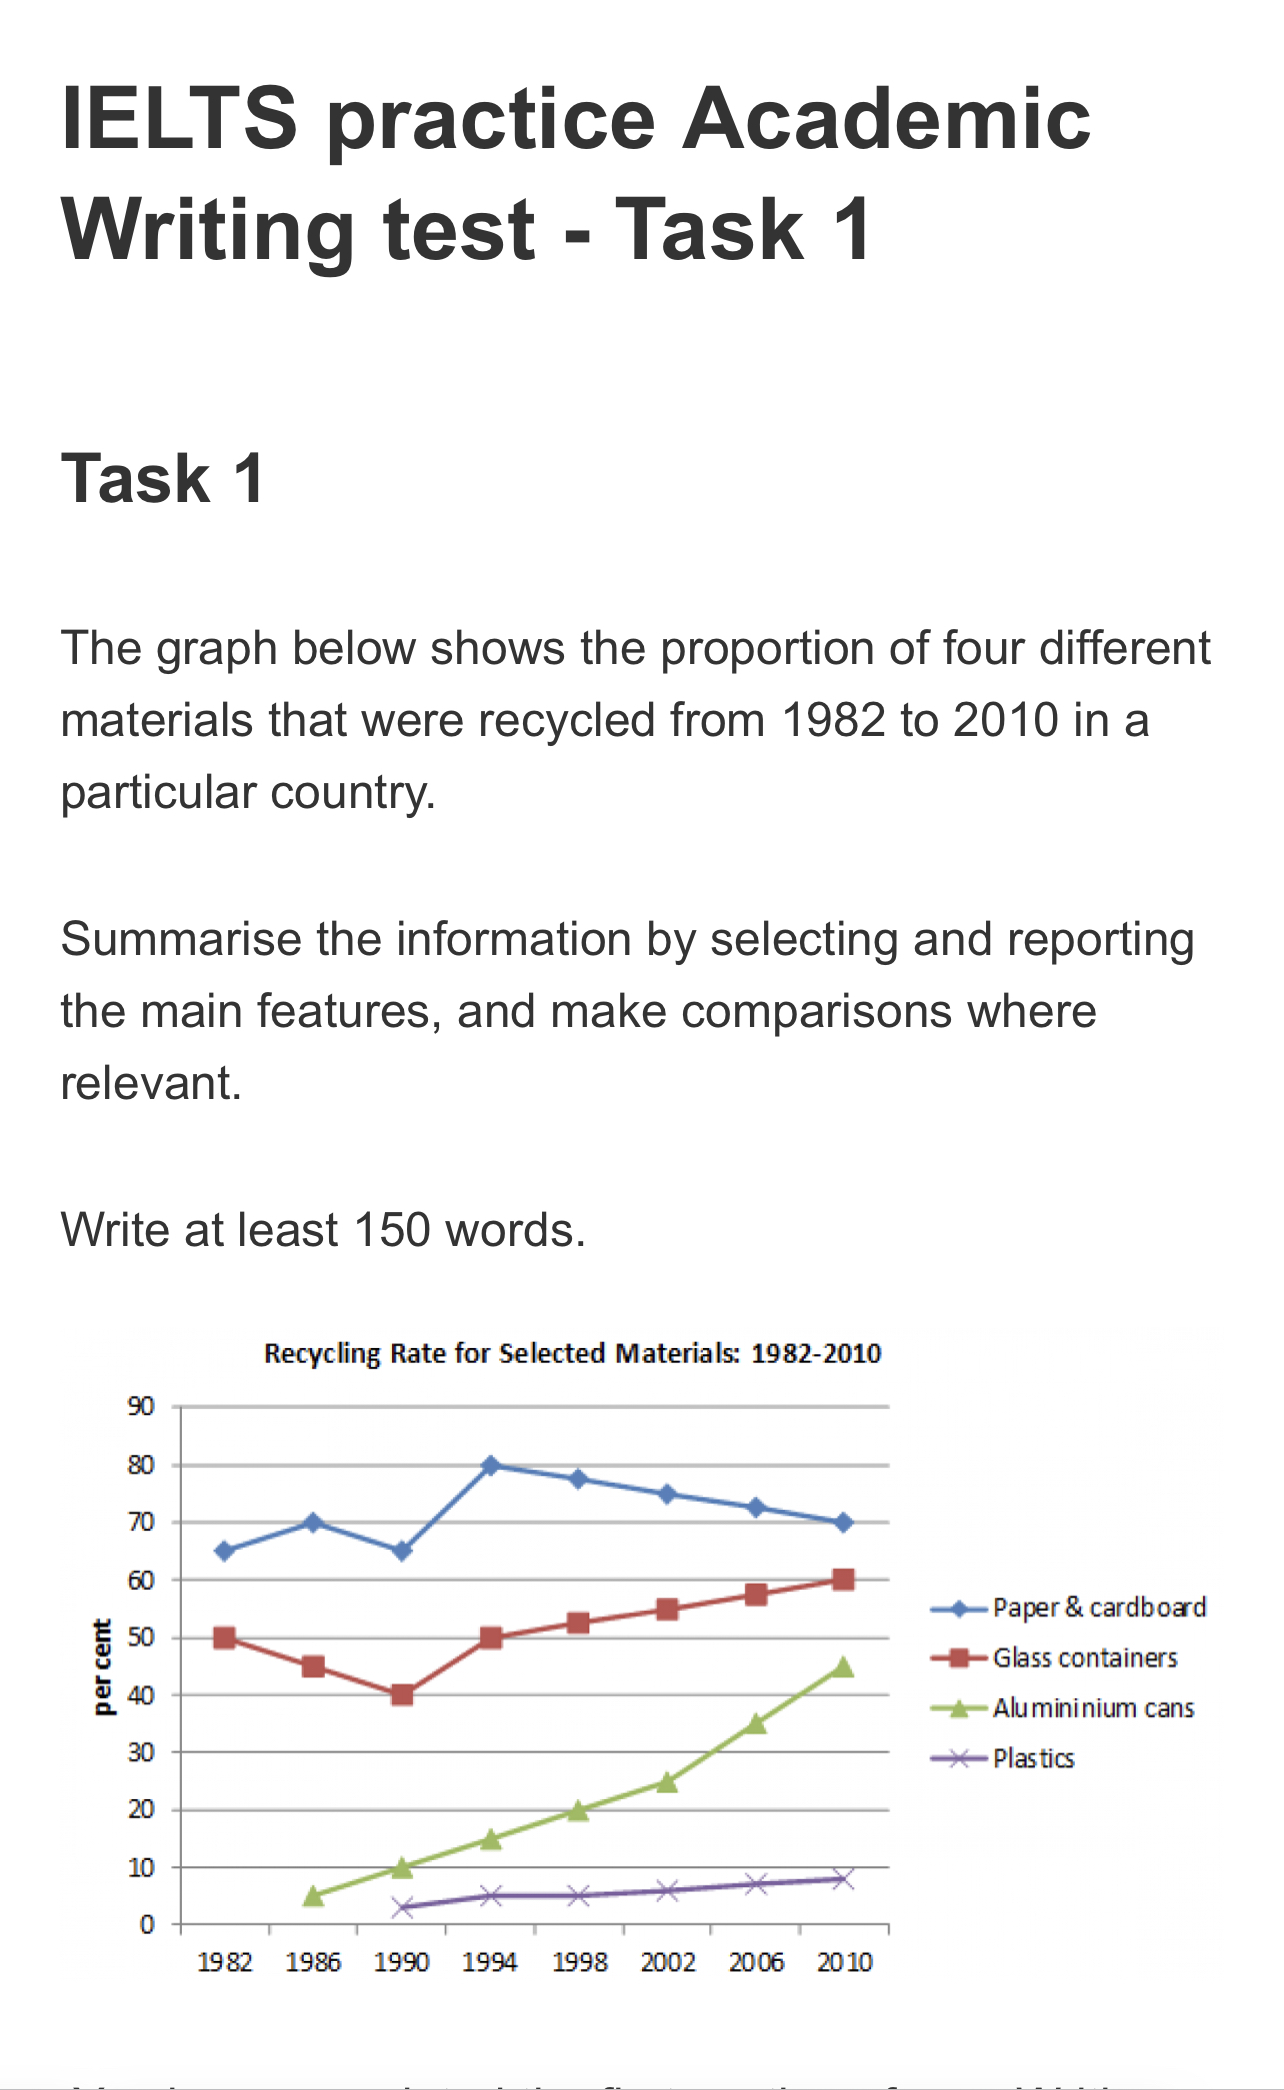
Four different items that were recycled from 1982 to 2010 in a particular country is illustrated in the graph. Paper, cardboard, glass containers, aluminium cans and plastics are the four materials being compared in this line graph.
There has been a significant increase in recycling of aluminium cans at 40 percent. However, reusing glass containers is observed to only have a 10 percent increase.
Meanwhile, we can note a 5 percent decline in recycling of paper and cardboard materials from the year 1994.
It is interesting to note that there is a dip in recycling of paper, cardboard and glass containers in the year 1990 probably because of the Gulf war.
Recycling of plastic Materials has been almost stagnant in the 10 stated years (less than 5 percent)
Only an Increase in recycling materials can ensure a better world for our future generations and every country should prioritise recycling.
Dissecting this sample task 1
- rephrasing the question for the first paragraph
- Paragraphs!
- Use synonyms (recycle – reuse, materials – items)
- Using connecting words – meanwhile, it is interesting to note
- Conclusion (be creative)
- Stick to the word limit.


